DataBods draws each person, purchase, visit, ship or bus as its own dot, and moves them all as you ask new questions. Charts, maps, journeys and time, in one place, with stories that present themselves.
Runs in your browser. Nothing to install, and your data never leaves your machine.
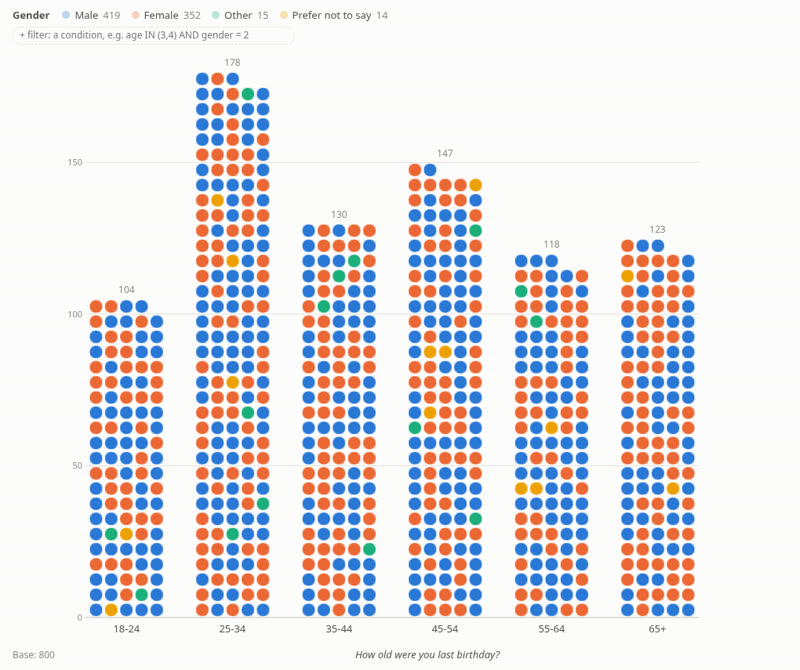
Every example opens live in the app. Click a bar, change the question, press play: the dots move.
Every respondent is a dot. Split by any question, rate scales either side of zero, and test subgroups for significance.
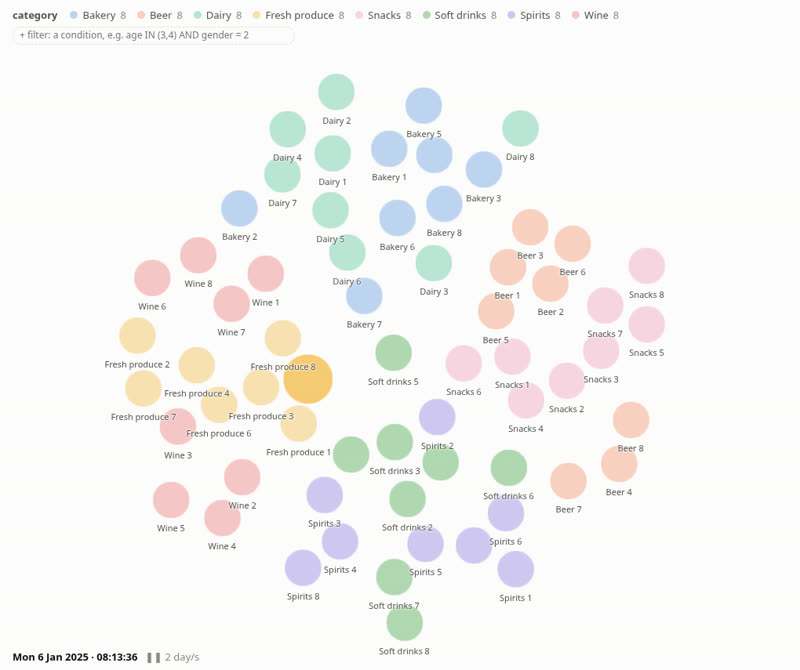
Try it →Step from people into their baskets and every purchase, or nest them five levels deep, without losing a single one.
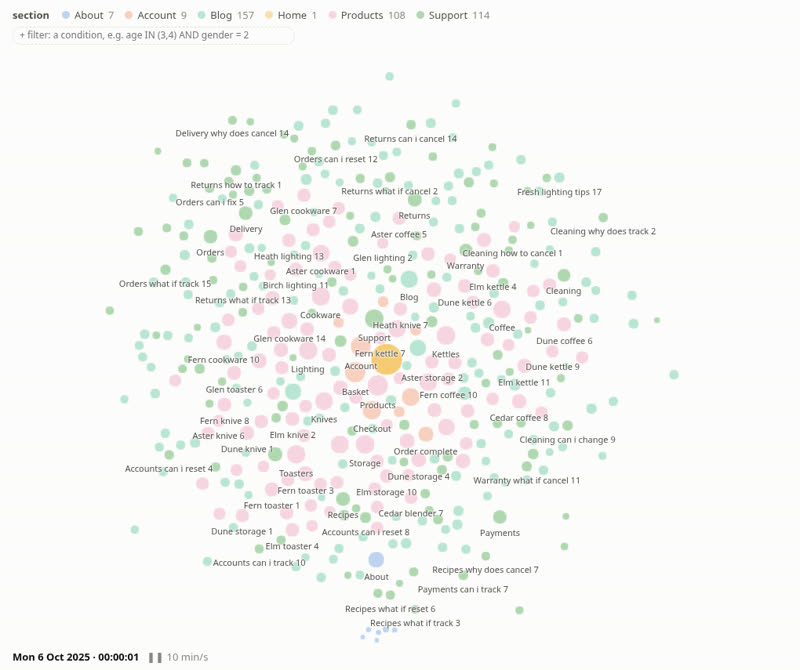
Try it →Pages arranged by the routes visitors actually take, with a day of visits flowing through, funnels and segments.
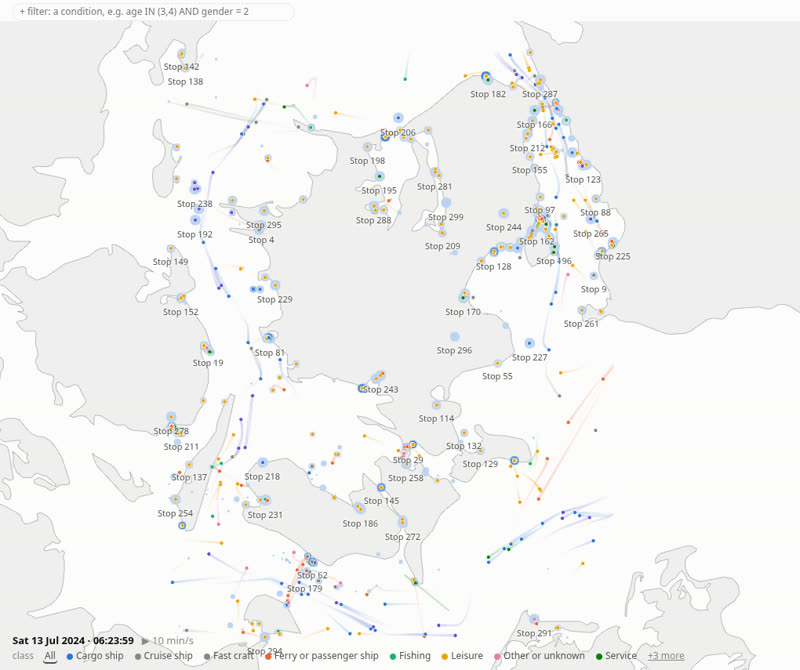
Try it →A real summer Saturday of ship positions: tankers, ferries, cargo and cruise ships, with ports found from where they stop.
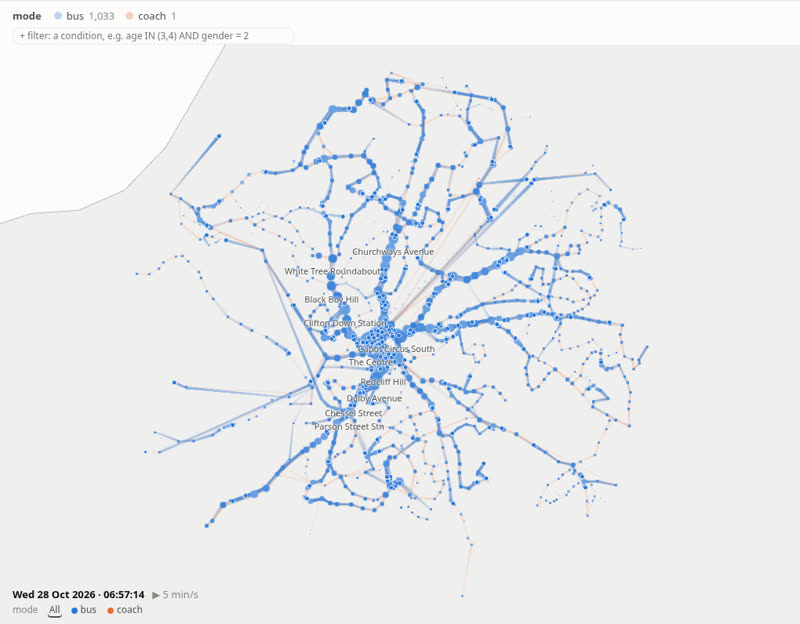
Try it →Open timetables come to life: every scheduled bus on its route through the day. Bristol, Zürich, Geneva, Wales and more.
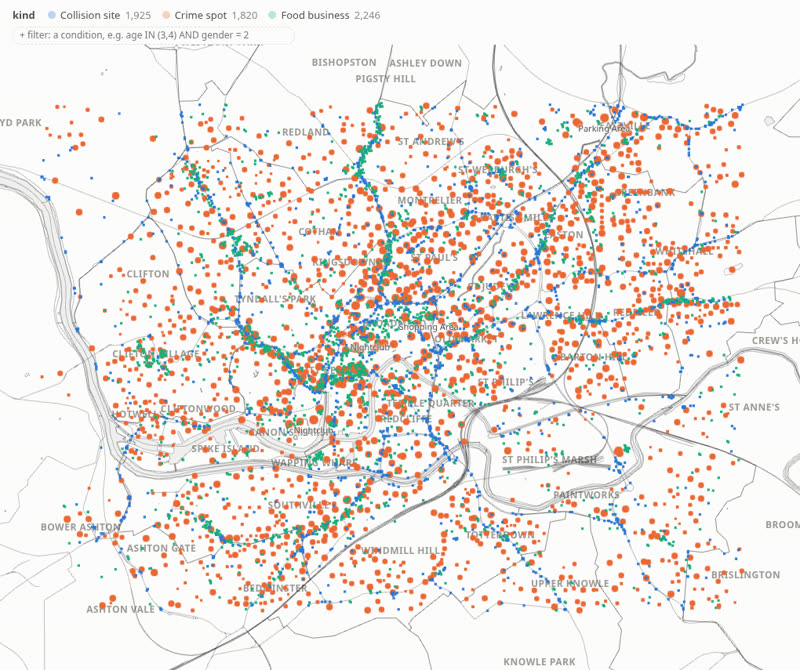
Try it →Central Bristol's open data joined up by ward, on one map and one clock. How much crime happens near a pub?
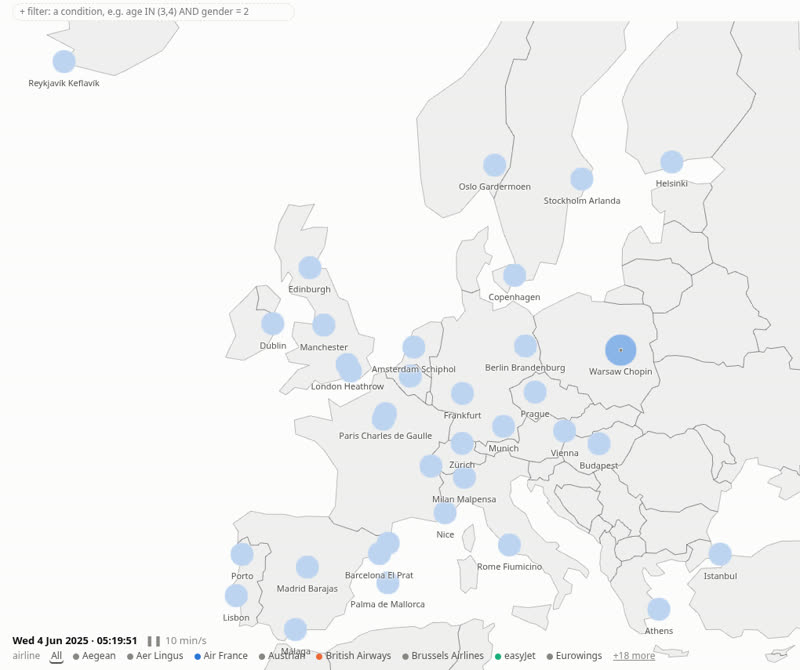
Try it →A day of flights between real airports, climbing and descending in 3D, with airports pulsing at every departure.
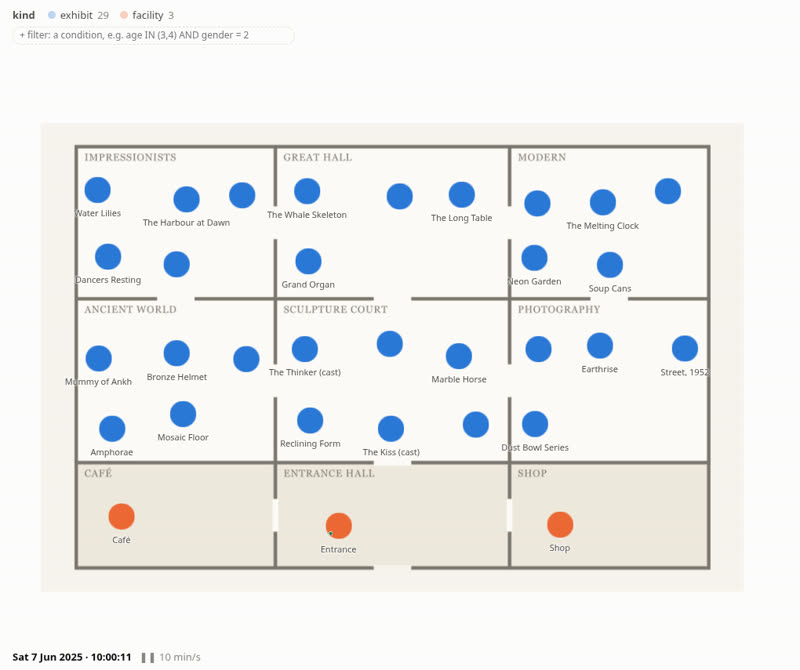
Try it →People moving room to room on a floor plan, with exhibits sized by who stopped to look.
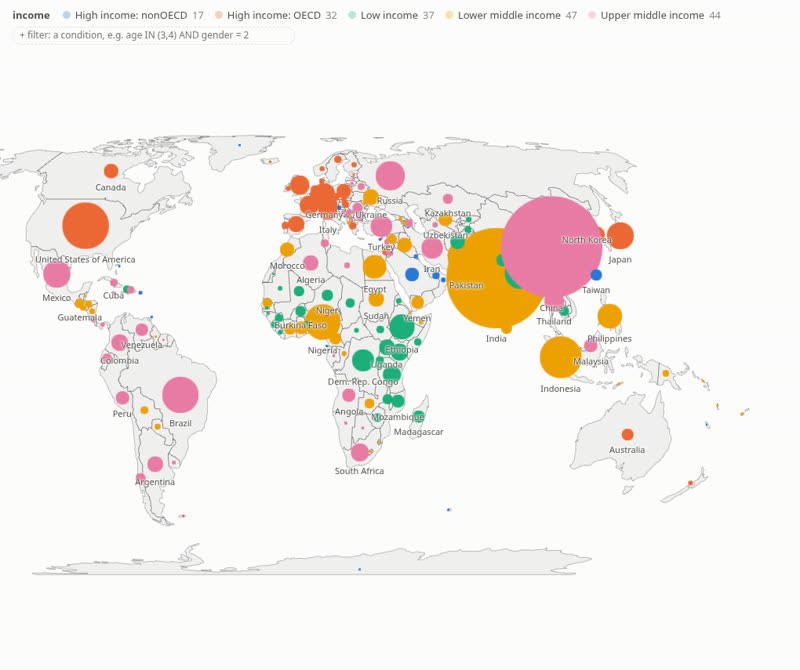
Try it →Countries sized by population on outline maps that morph with the dots as you change projection.
Try it →Open your files in the app. They are read in your browser and never uploaded.
CSV files and SQL dumps, with question labels from your definition file. Grids and multi-answer questions just work.
People, orders, products and stores: DataBods finds the links between tables and lets you move between levels.
Web server logs become pages, visits and journeys. Any table with dates can play over time.
Open timetables (GTFS), GPS and position tracks, and maps from coordinates, outlines or your own floor plan.
Everything you do is recorded as you click. Turn it into a story and it presents itself.
Each change becomes a step. Add titles, text and timing, then play it back with the dots flying between charts.
Steps wait for your click, with the question and base under each chart and the controls one tap away.
Sync steps to an audio track, or let your audience choose where the story goes next.
Print every slide at the end of its animation, ready to send.